Stock movement overview
Items | Stock movement overview
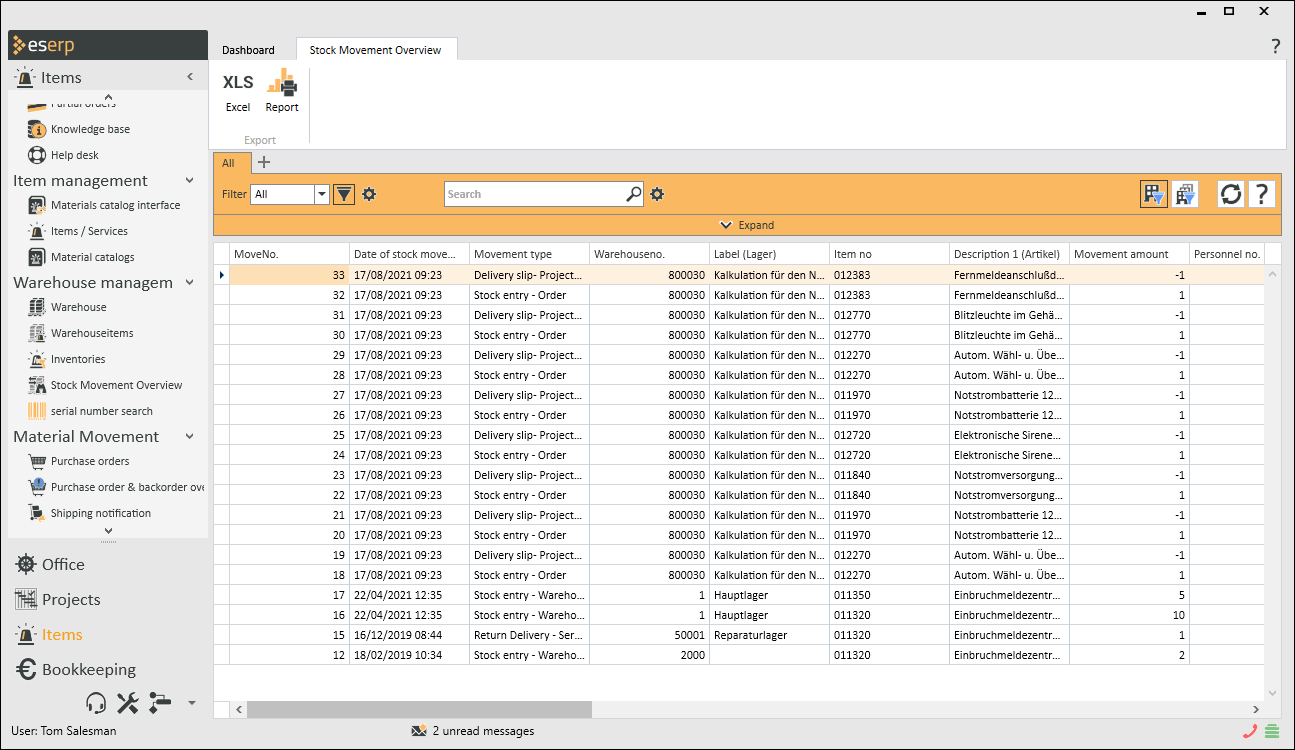
This is simply a display of a list in which every movement within a warehouse, from outside into a warehouse, and out from a warehouse is recorded.
Subquery
Because every movement is recorded in this list, it is necessary to use the filter function when searching in the list to restrict the data to the different values or areas.
The table can also be sorted according to the column headers. This is done by simply clicking on the column headers.
Search
You can position on a particular data set by means of an entry in the search field.
Functions / Toolbars
Various functions are provided in the toolbars (ribbons / ribbon bars) above the tabs.
The toolbar structure depends on the current module / tab.
Some toolbars are only shown when you edit certain fields, such as the Text toolbar when you edit rich text fields.
Toolbar
'Export' area
![]() Excel
Excel
You can save the displayed data as a list in MS Excel format (*.xlsx or *.xls) using this button. The current column, filter, and search settings are considered when the data is exported.
![]() Report
Report
Reports can be used to print out or send the displayed information for an address or process. The reports that are registered for the current program point are displayed when you click on the Report button.
The order and order confirmation can be printed out using the ![]() icon.
icon.
Also see Registration
Column selection / Column editor
The columns to be displayed in a Data Grid can be set using the Column Selection dialog. To open Column Selection, right click on the table column header and choose Show Column Editor from the context menu.

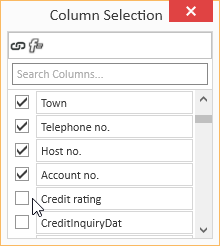
In the Column selection window, you can show the desired columns by activating the option in front of the column name.
Deactivate the check box in front of the column name to remove the column from the list view.
To save the list view layout, right click on the column header and select Save layout from the context menu.
Move columns / Change column order
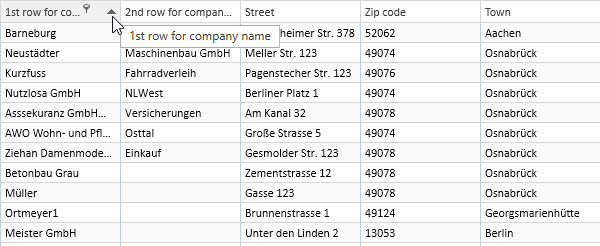
Each user can set the column order individually. To move a column, click on the column and hold down the left mouse button, drag it to the desired position between two columns and release the mouse button (drag and drop).
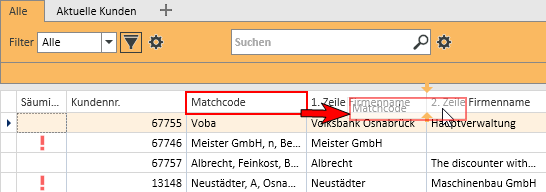
Suitable locations for inserting a column are marked with two colored arrows.
Optimum width
Adjusts the column width to automatically match the contents. Right click on the column header and select Optimum width from the context menu.
Use the Save layout function to permanently store the changed column width.
If you do not save the Layout after changing the column width, the column width will be reset when you restart the module.
Optimum width (all columns)
Adjusts the column width to automatically match the contents for all columns. Right click on the column header and select Optimum width (all columns) from the context menu.
Use the Save layout function to permanently store the changed column width.
If you do not save the Layout after changing the column width, the column width will be reset when you restart the module.
Column filters
You can use column filters to display only certain data sets from extensive lists.
You can use the column filters for example to display all the client data sets for a particular ZIP code. Only the ZIP codes that are already recorded for the client data sets will be displayed.
To filter the data sets, click on the desired column (for example ZIP code) and on the filter icon ![]() there.
there.
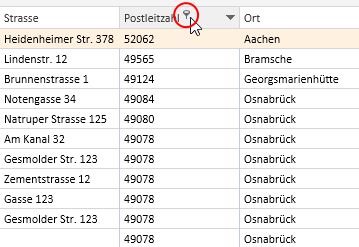
You will now see a list of all the recorded ZIP codes.
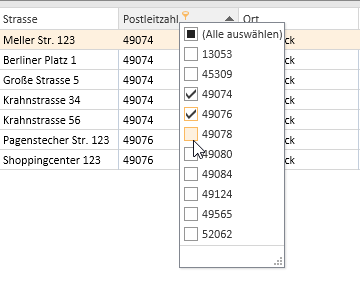
You can now select one or more values for the filter. There are also additional filters available (all, user defined, empty, not emptry).
If a filter is active for a column, this is indicated by the colored filter icon ![]() in the column header. Click on the icon to edit the filter.
in the column header. Click on the icon to edit the filter.
Sort order
The values in a column can be sorted in ascending or descending order by clicking on the table column header.
You can sort rows without changing existing sort conditions as follows:
-
Press and hold down the Shift key and click on the column header until an up or down arrow appears
-
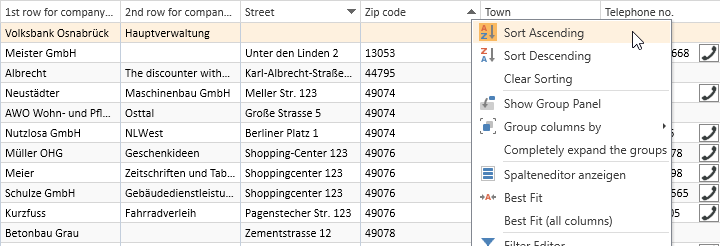
Right click on the column header and select Ascending order or Descending order from the context menu.
In the above example, the list is sorted by Zip code (ascending order) and additionally by Street (descending order). Thus, if there are several entries with the same Zip code, these entries will be sorted according to the Street field.
To remove a column from the sort criteria, press and hold down the Ctrl key and click on the column.
Column summaries
A column summary can be displayed below each column in the list.

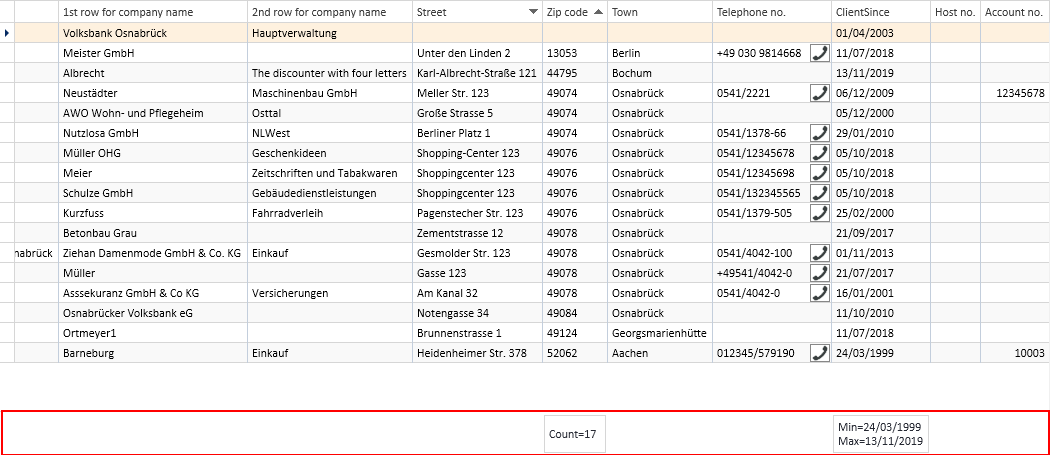
To configure this column summary, right click on the column header and select Show Sums from the context menu.
A Totals field is now shown below the list. Right click in this field to select the value to be displayed for this column.
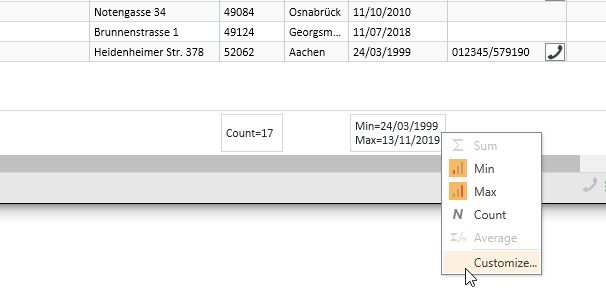
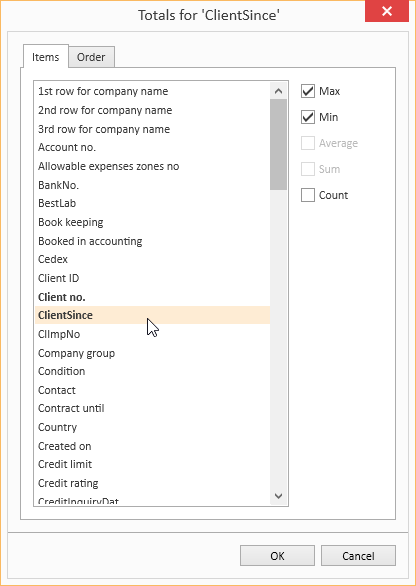
You can use the Customize... context menu command to make more detailed settings for the column summaries, including setting the Sort order and labeling when there are several sums.
Groupings
To group according to one or more columns, proceed as follows:
Method 1
- Right click on the column header and select Show grouping field from the context menu.
- Drag a column header into the Grouping field.
- You can drag additional columns into the grouping field to further subdivide a grouping.
- To remove the grouping, drag the column header from the group selection field and drop it back in the list or select the Remove grouping command in the context menu.
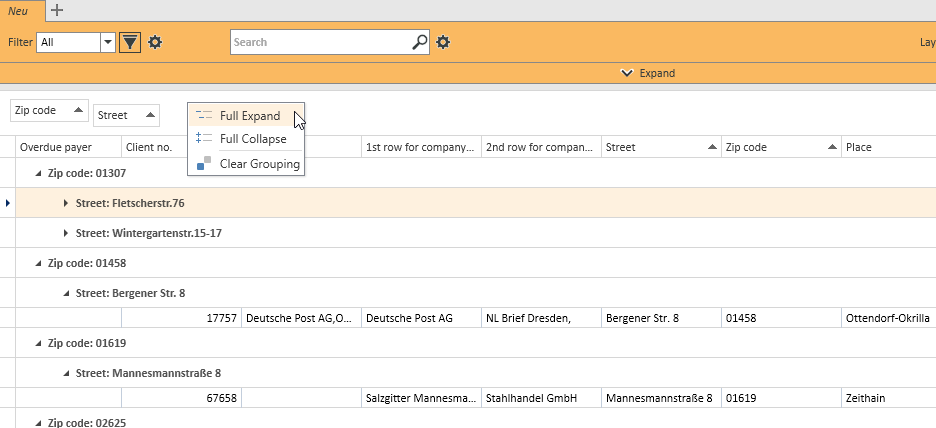
Method 2
Right click on the column header and select Group columns by from the context menu. You can now select whether to use the Standard grouping or grouping according to Initial letters.
To remove the grouping, right click on the column header or the particular column in the Group Selection field and select Remove Grouping from the context menu.
Grouping summaries
Summaries can be displayed for individual groupings.
To do this, right click in the column header in the Group Selection field and select Group Sum Editor from the context menu.
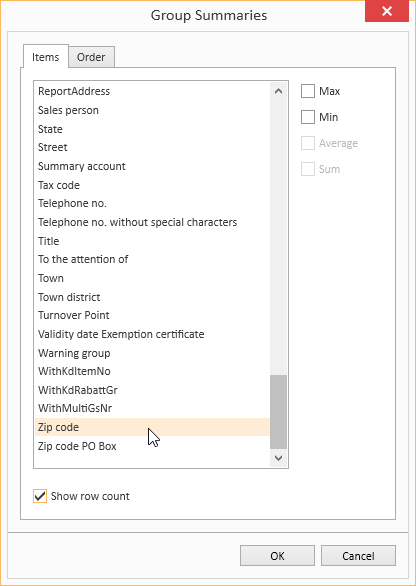
You can now define criteria for a Group Summary in the Group Selection dialog. You can use the Show number of rows option to display the number of data sets in a group.
Sort according to Grouping summaries
When a data grid has been grouped and a Grouping summary has been defined, the grouped data grid can also be sorted according to the values in the Grouping summary. Right click on the column header that is used for the grouping and select Sort by Group sorting from the context menu.
Calculated Fields
You can create Calculated fields in the Column editor. To do this, open the Column editor and click on the Add calculated field button.
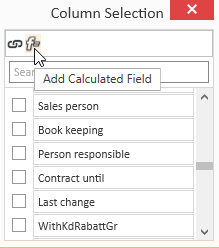
First, you will be asked for a field name. Enter the header for the Calculated Field in the box. When you click OK to confirm the dialog, the Expression editor opens.
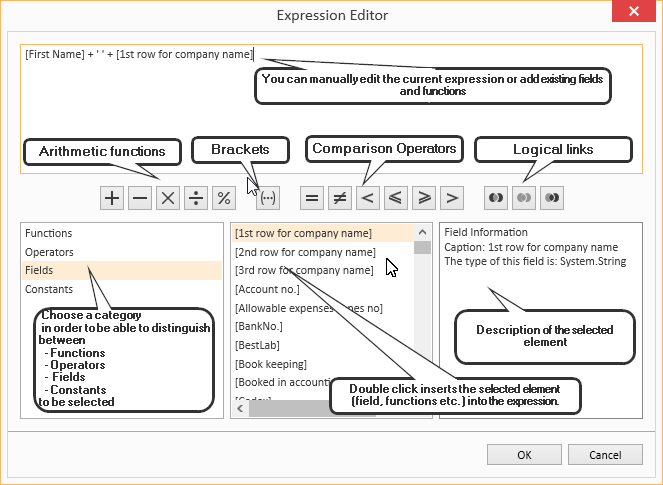
You can find a list of the functions and operators under Functions in Calculated fields.
To later edit the Expression, right click on the table column header of a Calculated Field and select Edit Expression from the context menu.
Iif(IsNullOrEmpty([Vorname]), [1. Zeile Firmenname], [Vorname] + + [1. Zeile Firmenname])In this example, the First name and Company 1 fields are combined into one field with a space between them, but only if the First name field is filled out. Otherwise, only the Company 1 field is output.
Field Background color
Data fields that meet certain conditions can be highlighted with a Background color.
To set Background colors for individual fields, right click on a column and select Background color from the menu.
You can now define a new rule. All the fields that match this rule will then be highlighted in the selected color.
The pencil icon opens the Expression editor. You can create more complex expressions with this editor. Also see Calculated Fields.
When you have successfully created a rule, close the window by clicking the OK button. The rule will be applied when you refresh the View.
Rule: [NoEmployees] < 30
Color: #FF009DFF
This rule colors all fields in the Client no. column blue if the number of employees entered in the corresponding data set is less than 30.
Using and Managing layouts
Right click on a column to open a context menu where you can access the Layout settings.
Load Layout
The Load layout command displays all the layouts that you have already created.
You can easily switch to another Layout here.
Save Layout / Save Layout As
When you Save Layout, the current View will be saved in the currently open Layout. All Expressions, Calculated Fields and Sort Groups will be included in this Layout and can be applied as required.
You can use the Save Layout As command to save the current View as a new separate Layout.
Specify the Layout properties for this.
Edit Layout
If you want to change the properties of the current Layout, select Edit Layout Properties from the menu. The Layout properties window opens. You can make the changes that you want here.
Reset Layout / Delete Layout
If the edited Layout is not what you want, you can undo the changes you made and revert to the original Layout by selecting Reset Layout from the menu. You can also use the Delete Layout command in the menu to delete a Layout entirely if you no longer want it.
Field meanings
Movement no.
An internal consecutive number (movement number) is allocated to each stock movement.
Movement date
The date (and time) of the stock movement is recorded against each movement.
Movement type
Eack stock movement is assigned a stock movement code that indicates the type of stock movement.
Also see Stock movement codes
Warehouse no. / Description (warehouse)
The Warehouse number and Warehouse description of the warehouse where the moved line item originated are displayed.
Item no. / Description 1 (item)
The Item number and Item description 1 of the item that was moved are shown here.
NoMoved
Number of items moved
Personnel no. / Display name (personnel)
Every movement is initiated by an employee. The Personnel number and name of the employee are displayed.
Office branch no.
Display of the office branch where the stock movement was made.
Remaining stock
Number of items remaining in the warehouse.
Performed on
Date service performed.
Info
Further information is entered (the stock prior to inventory is entered in the information for an item inventory so that the inventory is performed completely), the target personnel number (for stock moved to an installer) and removed by (the person removing the stock - name) are also displayed.
Offset account /Cost centers / Cost units
The designated offset accounts, cost centers, and cost units are included from the corresponding delivery slips.
Stock entry note no.
The Stock entry note number is also noted in the stock movement overview when a stock entry note is booked.
Delivery slip no.
The Delivery slip number is noted in the stock movement overview when a delivery slip is booked from a warehouse (regardless of where).
Order no. / Order ID no. / Order line item no.
If the stock movement relates to an order, the Order number as well as the internal Order ID number and the Order line item number for this order are also entered.
Object description (order)
The description from the particular order is shown here.
Target warehouse no. / Description (target warehouse)
If the stock movement is a warehouse transfer, the Target warehouse and its Description are displayed (that is, the warehouse into which the line item was booked).
Calculation no.
If the stock movement relates to a calculation folder, the Calculation number is entered here.
Stock level / Movement type
The Stock level after the booking and the Movement type are entered for each movement.
Inventory
Movements caused by an inventory are also shown here.
Further columns can be added using the column editor.